What is the Kubernetes Dashboard?
Kubernetes Dashboard is a web-based user interface to visualize the Kubernetes cluster. It shows you the details of the Kubernetes cluster, which includes the nodes in the cluster, namespaces, volumes, cluster roles, job details, and much more. You can deploy a containerized application through the Kubernetes dashboard with just a few clicks and manage all the cluster resources with ease.
Prerequisite
You must have a running Kubernetes cluster before setting up a Kubernetes dashboard. Read this article to learn how to set up Kubernetes.
Deploy Kubernetes Dashboard
Run below kubectl command on the master node to deploy the Kubernetes dashboard. You can see dashboard pods are in running state now.
Access Kubernetes Dashboard
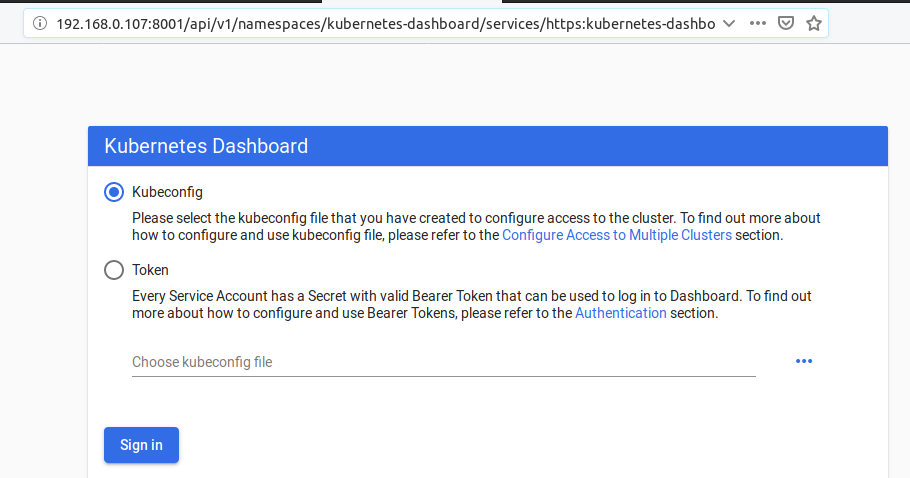
Run the below command to access Kubernetes dashboard at 192.168.0.107:8001 (change this to your IP) Open the browser and go to the link below to login to the Kubernetes dashboard. These are the two ways to login to Kubernetes Dashboard.
Token kubeconfig
Generate Token to log in
In the default namespace, create a service account.
Create cluster binding rules for the newly created service account.
Run the kubectl command below to generate the token
You can use the generated token (as shown above) to login to the dashboard.
kubeconfig
The other way to login is by using the Kubernetes configuration file.
Select the option Kubeconfig and click on “Choose Kubeconfig file.”
Use the admin.conf, file present at $HOME/.kube/config/ path and login to the dashboard successfully
Dashboard Interface
This is how the dashboard interface will look like. You see the details of the Nodes, Persistent Volumes, Namespaces, Cluster Roles running in the Kubernetes cluster. Using the dashboard, you can write YAML code in the editor to add new resources to the cluster. Once the cluster has multiple jobs running, you will get more visualization options. It will tell you which jobs failed or passed. If there is an issue with the cluster, you can see it in the dashboard easily.


